Abstract
-
Purpose
- The present study aimed to identify the learning preferences of dental students and to characterize their relationship with academic performance at a dental school in Isfahan, Iran.
-
Methods
- This cross-sectional descriptive study included 200 undergraduate dental students from October to November 2016. Data were collected using a 2-part questionnaire. The first part included demographic data, and the second part was a Persian-language version of the visual, aural, read/write, and kinesthetic questionnaire. Data analysis was conducted with the chi-square test, 1-way analysis of variance, and multiple linear regression.
-
Results
- The response rate was 86.6%. Approximately half of the students (51.5%) had multimodal learning preferences. Among the unimodal group (48.5%), the most common mode was aural (24.0%), followed by kinesthetic (15.5%), reading-writing (8.0%), and visual (1.0%). There was a significant association between academic performance and the reading/writing learning style preference (P< 0.01).
-
Conclusion
- Multimodal learning styles were the most preferred. Among single-mode learning styles, the aural style was most common, followed by the kinesthetic style. Students with a reading/writing preference had better academic performance. The results of this study provide useful information for preparing a more problem-based curriculum with active learning strategies.
-
Keywords: Academic performance; Dental students; Iran; Learning methods; Problem-based learning
Introduction
- Learning style has been described as a complicated process in which the learner should perceive, process, save, and recall concepts efficiently and effectively [1]. Learning style has been considered to be a combination of cognitive, emotional, and physiological factors that are influenced by environmental factors [2]. Several methods have been developed to measure learning styles, including the validated visual, aural, read/write, and kinesthetic (VARK) questionnaire created by Fleming [2]. He defined the 4 sensory aspects as follows. Visual learners learn by seeing figures, diagrams, films, and maps. Aural learners learn by listening to lectures, discussions, and speeches. Learners with a reading/writing style learn by reading books, course notes, and notes. Kinesthetic learners learn by touching and experience, physical actions, and working with their hands.
- Students’ learning preferences may be influenced by several factors, including gender, age, major, and sociocultural factors [3]. Contradictory results regarding these potential influences have been reported in various studies [3-6]. If students become aware of their learning style preference, they can learn more information in a shorter time [7]. Therefore, it is important to identify students’ learning style preferences in order to design an effective educational curriculum. The present study aimed to identify learning preferences among dental students in Isfahan, Iran and to characterize the associations between learning preferences and past academic performance, as represented by students’ grade point average (GPA).
Methods
- Ethical statement
- This study was approved by the research committee of the dentistry department of Isfahan University of Medical Sciences (approval #394850). After explaining the purpose of the study to students, informed written consent was obtained. Participation in this study was optional, and personal information and all responses were kept confidential. Respondents were assured of their right to withdraw from the study at any time. The GPA was taken by a staff member of the college educational administration based on the student ID number in separate forms. Then the results were analyzed by the researcher (NAR A) who did not know the students or their ID numbers.
- Study design
- This research was performed as a descriptive-cross sectional study from October to November 2016 at the Dental School of Isfahan University of Medical Sciences, Isfahan, Iran.
- Materials and/or subjects
- The participants consisted of undergraduate dental students, and were divided into 2 groups, depending on whether they were in the preclinical course (second-year) or the clinical course (fourth, fifth and sixth year). First-year dental students were not included because they had not yet attained a GPA. Students who chose not to complete the questionnaire were excluded as well.
- Technical information
- To maximize the representativeness of the data, all the second-, fourth-, fifth-, and sixth-year dental students (n= 231) were selected using the census method. A total of 200 students answered the questionnaire from the target sample of 231.
- After providing informed written consent, the participants were invited to respond to the questionnaires anonymously. The participants were visited during their regular classes by the researchers, who handed them the questionnaires, and then the questionnaires were collected once complete. Before filling out the questionnaire, the necessary information was explained by the researchers.
- Study instrument
- Data were collected using a 2-part questionnaire. The first part included questions on demographic data, such as age, gender, marital status, stage of the degree program (preclinical or clinical), and academic performance data. Academic achievement was measured by GPA, which accessed from the students’ educational records based on their student identification number. The second part was the VARK questionnaire developed by Fleming [2], which was used to determine students’ learning preferences. The latest English version of the VARK questionnaire was used in this study (VARK 7.1). The VARK questionnaire consists of 16 questions with 4 options each.
- In this study, the instrument was administered using a printed form that was downloaded from the official VARK website. All choices corresponded to the 4 sensory modalities measured by the VARK questionnaire (visual, aural, reading/writing, and kinesthetic). The participants were asked to select the choice that best described their priority for each item; they were permitted to mark more than 1 choice, if necessary. In addition, they were asked not to answer questions that they did not understand. The English questionnaire has been used with students in many studies around the world [2,7-9] and its validity and reliability have been assessed.
Validity and reliability of the Persian questionnaire
- The English version of the VARK questionnaire was translated into Persian, the students’ native language. In Persian, words may have different meanings. Therefore, the translated VARK questionnaire was first tested for reading comprehension in a group of students who were not part of the group analyzed in the present study. The translated questionnaire maintained the original lettering order of the 4 choices in each question.
- To verify the face and content validity of the questionnaire, it was submitted to 5 expert members of the pediatric dentistry faculty. Then, the answers were computed according to the following content validity ratio (CVR) formula: CVR= , nE-N/2N/2
, where nE is the number of experts who selected the question as necessary, and N is the total number of experts.
- After the answers of the experts were collected, questions with a CVR score lower than 0.42 were excluded [10]. The number of questions in the primary questionnaire was 16. One question (“You are not sure whether a word should be spelled ‘dependent’ or ‘dependant’. You would:”) was excluded after CVR review, because in the experts’ opinion, the Persian translation of this question was meaningless without using the English word. As we used the forward-backward translation method, the Persian translation was returned to English again and reviewed by a language expert. Therefore it was not applicable to use a word with different spells in Persian (for example use letters such as ذ ,ض ,and ظ in a Persian word) in translatation from Persian into English.
- Fifteen questions were finally approved by the experts, who were then asked about face validity. The questionnaire was pilot-tested on 20 students to evaluate its comprehensibility. The Cronbach alpha was used to ensure the reliability of the attitude-related questions after pilot-testing, and reliability was confirmed (Cronbach alpha=0.86).
Data analysis
- The VARK questionnaire was analyzed using the stepping-stone method explained on the VARK website [2]. The students were classi- fied according to their preferred sensory modality for learning as visual, aural, reading/writing, or kinesthetic learners. The preferred sensory modality was the modality that received the highest score in each individual VARK questionnaire [2]. The number of students who preferred each mode of learning was divided by the total number of responses to determine the percentage of students in each category.
- Statistical analysis
- Data were analyzed using IBM SPSS ver. 21.0 (IBM Corp., Armonk, NY, USA). The data were reported as the percentage of respondents in each learning preference category. Analysis of variance (ANOVA) was used to investigate differences in GPA and students’ learning preferences. The chi-square test was performed to compare the distributions of learning preferences by gender and marital status. GPA was classified into 3 groups, and the chi-square test was performed to investigate the relationship between GPA and students’ learning preferences. The Fisher exact test was used when the chi-square test was not suitable. P-values < 0.05 were considered to indicate statistical significance. Multiple linear regression was used to examine the relationship between GPA as a dependent variable and learning preferences, after adjusting for variables used in other studies.
Results
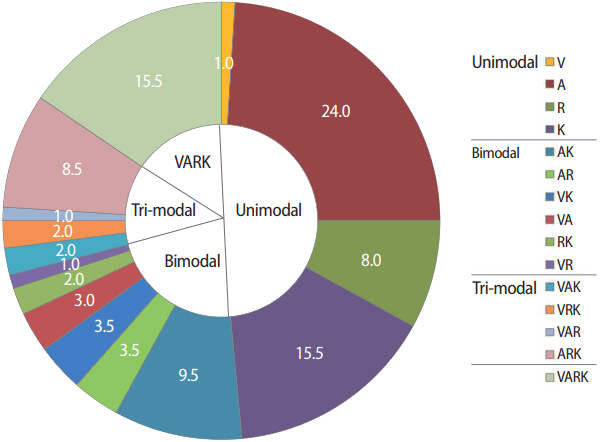
- Of the 231 undergraduate dental students invited to participate in the study, 200 students answered the questionnaire. The response rate was 86.6%. Table 1 presents a comparison of learning preferences and characteristics among dental students. Raw data are available from Supplement 1. Half of the students (51.5%) had a multimodal learning preference. The VARK mode distribution among students was unimodal, followed by bimodal, quad-modal, and trimodal modal with the percents of 48.5, 22.5, 15.5, and 13.5, respectively.
- The distribution of learning preferences is shown in Fig. 1.
-
Table 2 shows the distribution of students’ preferred learning styles and mean GPA, as analyzed using ANOVA. No statistically significant relationship was found between GPA classification and learning style preferences based on the Fisher exact test (P=0.15) (Table 1). There was no significant difference in individual sensory modality preference among unimodal learners based on ANOVA (P= 0.07). However, there was a significant association between GPA and the reading/writing learning style preference (P= 0.01) (Table 3). Learning style preferences did not differ between male and female students according to the chi-square test (P= 0.95). No significant relationship was found between marital status and learning style preference (P= 0.43, F-test=2.4)
- There was no significant difference in learning style preferences according to whether students were in the preclinical or clinical course (P= 0.79, F-test= 2.4). As secondary results, using multiple linear regression analysis, the following findings were obtained. A significant relationship was found between gender and GPA, with females having a higher GPA (P= 0.005). Younger students had a significantly higher GPA (P=0.001). There was a significant relationship between marital status and GPA, with married students having a higher GPA (P= 0.025).
Discussion
- In the present study, half of the students had multimodal learning preferences (2–4 styles), and 48.5% preferred a single-mode learning style. The most common learning preferences in this study were unimodal, followed by bimodal, quad-modal, and tri-modal. In this study, students had different learning preferences, which mean that educators must use multi-sensory engaged learning strategies to be inclusive of all types of learning preferences and modes of metacognition. The aim of this study was to determine the relationship between learning style preference and GPA using the standard VARK questionnaire, and to assess whether this relationship was affected by gender, marital status, and students’ year of study in the curriculum.
- Since the students reported several learning style preferences, it was difficult to investigate the relationship between every student’s learning style(s) and her/his GPA. Therefore, we investigated the relationship between students’ GPA and having or not having one of the visual, aural, reading/writing, and kinesthetic learning styles. One of the main findings of this study was that individuals with a reading/ writing learning style preference had better academic performance than individuals without a reading/writing learning style preference. However, no statistically significant difference was found in GPA between students with different learning style preferences considered separately. This lack of significance might be due to the fact that GPAs were similar in students with different learning preferences. At the Isfahan Dental School, the teaching method for theoretical courses features passive lectures with PowerPoint (aural, visual) in large classes. Students make notes in classes (reading/writing style). However, in the present study, only 1%, 24%, and 8% of the students were found to be visual, aural, and kinesthetic learners, respectively. Therefore, it seems that the compatibility between teaching methods and students’ learning styles at this college must be reviewed. This observation encouraged us to propose reductions in passive lecture hours and to prepare a more problem-based curriculum.
- According to previous research [11], the use of active learning strategies lead to better student learning, because such strategies involve a variety of learning styles, enhance learners’ thinking and reasoning, and improve skills such as problem-solving and decision-making. Discussions, small-group learning exercises, role-playing, simulations, models, challenges, and games are active teaching methods that can be utilized in a class with large number of students. A limited number of studies have evaluated the relationship between learning style preferences and academic performance among dental students using the VARK method. In 4 studies [1,8,9,11,12], no significant relationship was found between learning style preferences and academic achievement. However, Al-Saud [6] reported that there was a significant relationship between GPA and learning style preference. A higher mean GPA was found among first-year dental students with the quad-modal learning style preference.
- This study found no significant relationship between learning preference and gender, which is consistent with the results of the study by Bennadi et al. [13]. However, Al-Saud [6] and AlQahtani et al. [14] found that males and females preferred different styles in Saudi Arabia. In the study by Sarabi-Asiabar et al. [3], males tended to have the kinesthetic style and females tended to learn using the aural style. Nonetheless, based on these contradictory results, it seems that if there are real differences in learning preferences related to gender, the differences are minor.
- Based on the findings of the present study, it can be concluded that students’ learning preferences are not influenced by factors such as age, gender, and marital status. In the clinical departments of our dental school, students are trained by touch and experience, physical action, and working with their hands (kinesthetic style). However, no significant difference was found between preclinical and clinical students regarding their learning preference; this result is consistent with those of the research by Asiry [15] on dental students.
- Among the limitations of the present study, it can be mentioned that the study was conducted in only a single dental school and may therefore not be generalizable to schools with students of different ethnicities/cultures and schools that use different academic methods.
- This study was cross-sectional, and it is therefore recommended to conduct longitudinal research to investigate the possibility that learning preferences may change over time. In conclusion, the preferred learning style of undergraduate dental students in our institution was multimodal. The aural style had the highest percentage among the single-mode learning styles, followed by the kinesthetic style. There was a significant relationship between the reading/writing learning style preference and academic performance. The results of this study provide useful information for proposing reductions in passive lecture hours and preparing a more problem-based curriculum using active learning strategies. The learning preferences of the students were not influenced by age, gender, or marital status.
Article information
-
Authors’ contributions
Conceptualization: NAJMEH A, MJ. Data curation: HM. Formal analysis: NARJES A. Funding acquisition: none. Methodology: NAJMEH A. Project administration: MJ, NAJMEH A. Visualization: NAJMEH A, MJ. Writing–original draft: NARJES A, NAJMEH A. Writing–review & editing: NARJES A, NAJMEH A.
-
Conflict of interest
No potential conflict of interest relevant to this article was reported.
-
Funding
This study was based on a thesis to be submitted to Dental School of Isfahan University of Medical Sciences (Isfahan, Iran). This work was supported by the Isfahan University of Medical Sciences (Vice Chancellery for Research, IUMS), which encourages independent research, particularly studies that are related to people’s health, under grant #394850.
Acknowledgments
The authors thank Neil D Fleming for permission to use the VARK questionnaire (copyright version 7.8 [2014] held by VARK Learn Limited, Christchurch, New Zealand).
Supplementary materials
Fig. 1.Percentages of unimodal learners who preferred a single mode of learning (V, A, R, and K), and learners who preferred 2 (bimodal) and 3 (tri-modal) (n = 200). V, visual; A, aural; R, reading/writing; K, kinesthetic; VARK, visual, aural, read/write, and kinesthetic questionnaire.

Table 1.Comparison of learning styles among undergraduate dental students based on demographic information (n=200)
|
Variable |
Unimodal
|
Bimodal |
Tri-modal |
VARK |
Sum |
P-value |
|
V |
A |
R |
K |
|
No. of students |
2 (1) |
48 (24) |
16 (8) |
31 (15.5) |
45 (22.5) |
27 (13.5) |
31 (15.5) |
200 (100) |
|
|
Gendera)
|
|
|
|
|
|
|
|
|
0.95b)
|
|
Male |
1 (1.1) |
19 (21.8) |
8 (9.2) |
15 (17.2) |
21 (24.1) |
10 (11.5) |
13 (14.9) |
87 (43.5) |
|
|
Female |
1 (0.9) |
29 (25.7) |
8 (7.1) |
16 (14.2) |
24 (21.2) |
17 (15) |
18 (15.9) |
113 (56.5) |
|
|
Marital statusa)
|
|
|
|
|
|
|
|
|
0. 43b)
|
|
Single |
2 (1.2) |
40 (23.8) |
12 (7.1) |
27 (16.1) |
36 (21.4) |
26 (15.5) |
25 (14.9) |
168 (84) |
|
|
Married |
0 |
8 (25) |
4 (12.5) |
4 (12.5) |
9 (28.1) |
1 (3.1) |
6 (18.8) |
32 (16) |
|
|
Students’grade levela)
|
|
|
|
|
|
|
|
|
0.79b)
|
|
Pre-clinical (year 2) |
0 |
15 (31.3) |
4 (8.3) |
6 (12.5) |
11 (22.9) |
7 (14.6) |
5 (10.4) |
48 (24) |
|
|
Clinical (years 4–6) |
2 (1.3) |
33 (21.7) |
12 (7.9) |
25 (16.4) |
34 (22.4) |
20 (13.2) |
26 (17.1) |
152 (76) |
|
|
Grade point average (mean)a)
|
|
|
|
|
|
|
|
|
0.15b)
|
|
12–14.99 |
1 (3.1) |
6 (18.8) |
1 (3.1) |
4 (12.5) |
12 (37.5) |
2 (6.3) |
6 (18.8) |
32 (16) |
|
|
15–16.99 |
1 (0.9) |
32 (27.6) |
9 (7.8) |
15 (12.9) |
23 (19.8) |
15 (12.9) |
21 (18.1) |
116 (58) |
|
|
17–20 |
0 |
10 (19.2) |
6 (11.5) |
12 (23.1) |
10 (19.2) |
10 (19.2) |
4 (7.7) |
52 (26) |
|
Table 2.Frequency distribution of students’ preferred learning styles and mean GPA (analysis of variance)
|
Learning preference |
Number |
GPA
|
|
Mean ± standard deviation |
95% confidence interval for mean |
Min |
Max |
|
Visual |
2 |
14 ± 2.82 |
11.41–39.41 |
12 |
16 |
|
Aural |
48 |
15.92 ± 1.2 |
15.57–16.27 |
12.25 |
19 |
|
Reading/writing |
16 |
16.53 ± 1.29 |
15.84–17.22 |
14.5 |
19 |
|
Kinesthetic |
31 |
15.99 ± 1.85 |
15.31–16.67 |
12 |
18.5 |
|
Bimodal |
45 |
15.76 ± 1.22 |
15.4–16.13 |
13.7 |
18.89 |
|
Trimodal |
27 |
16.06 ± 1.32 |
15.53–16.58 |
12 |
18 |
|
VARK |
31 |
15.49 ± 1.01 |
15.12–15.87 |
13 |
17.43 |
|
Total |
200 |
15.88 |
15.69–16.07 |
12 |
19 |
Table 3.Relationships between learning style preference (unimodal) and GPA among dental students
|
Student’s learning preference |
Frequency (no.) |
GPA (mean±standard deviation) |
P-value |
|
Visual |
|
|
|
|
Visual style |
2a)
|
14.00 ± 2.82 |
|
|
Not visual style |
198a)
|
15.95 ± 1.17 |
|
|
Aural |
|
|
0.74b)
|
|
Aural style |
48 |
15.92 ± 1.20 |
|
|
Not aural style |
152 |
15.63 ± 1.58 |
|
|
Reading/writing |
|
|
0.01c) |
|
Reading/writing style |
16 |
16.53 ± 1.29 |
|
|
Not reading/writing style |
183 |
15.53 ± 1.57 |
|
|
Kinesthetic |
|
|
0.21b)
|
|
Kinesthetic style |
31 |
15.99 ± 1.85 |
|
|
Not kinesthetic style |
169 |
15.62 ± 1.47 |
|
References
- 1. Jiraporncharoen W, Angkurawaranon C, Chockjamsai M, Deesomchok A, Euathrongchit J. Learning styles and academic achievement among undergraduate medical students in Thailand. J Educ Eval Health Prof 2015;12:38. https://doi.org/10.3352/jeehp.2015.12.38 ArticlePubMedPMCPDF
- 2. Fleming N. VARK a guide to learning styles: frequently asked questions [Internet]. Christchurch: VARK Learn Limited; c2001-2013 [cited 2016 Aug 10]. Available from: http://www.vark-learn.com/english/page.asp
- 3. Sarabi-Asiabar A, Jafari M, Sadeghifar J, Tofighi S, Zaboli R, Peyman H, Salimi M, Shams L. The relationship between learning style preferences and gender, educational major and status in first year medical students: a survey study from iran. Iran Red Crescent Med J 2014;17:e18250. https://doi.org/10.5812/ircmj.18250 ArticlePubMedPMC
- 4. Peyman H, Sadeghifar J, Khajavikhan J, Yasemi M, Rasool M, Yaghoubi YM, Nahal MM, Karim H. Using VARK approach for assessing preferred learning styles of first year medical sciences students: a survey from Iran. J Clin Diagn Res 2014;8:GC01-GC04. https://doi.org/10.7860/JCDR/2014/8089.4667 Article
- 5. Omar E. Perceptions of teaching methods for preclinical oral surgery: a comparison with learning styles. Open Dent J 2017;11:109-119. https://doi.org/10.2174/1874210601711010109 ArticlePubMedPMCPDF
- 6. Al-Saud LM. Learning style preferences of first-year dental students at King Saud University in Riyadh, Saudi Arabia: influence of gender and GPA. J Dent Educ 2013;77:1371-1378. ArticlePubMed
- 7. Shenoy N, Shenoy K A; U P R. The perceptual preferences in learning among dental students in clinical subjects. J Clin Diagn Res 2013;7:1683-1685. https://doi.org/10.7860/JCDR/2013/4940.3219 ArticlePubMedPMC
- 8. Almigbal TH. Relationship between the learning style preferences of medical students and academic achievement. Saudi Med J 2015;36:349-355. https://doi.org/10.15537/smj.2015.3.10320 ArticlePubMedPMC
- 9. Liew SC, Sidhu J, Barua A. The relationship between learning preferences (styles and approaches) and learning outcomes among pre-clinical undergraduate medical students. BMC Med Educ 2015;15:44. https://doi.org/10.1186/s12909-015-0327-0 ArticlePubMedPMCPDF
- 10. Saber A, Tabatabaei SM, Akasheh G, Sehat M, Zanjani Z, Larijani B. Face and content validity of the MacArthur competence assessment tool for the treatment of Iranian patients. Int J Prev Med 2017;8:75. https://doi.org/10.4103/ijpvm.IJPVM_367_16 ArticlePubMedPMC
- 11. Gadbury-Amyot CC, Redford GJ, Bohaty BS. Dental students’ study habits in flipped/blended classrooms and their association with active learning practices. J Dent Educ 2017;81:1430-1435. https://doi.org/10.21815/JDE.017.103 ArticlePubMed
- 12. Urval RP, Kamath A, Ullal S, Shenoy AK, Shenoy N, Udupa LA. Assessment of learning styles of undergraduate medical students using the VARK questionnaire and the influence of sex and academic performance. Adv Physiol Educ 2014;38:216-220. https://doi.org/10.1152/advan.00024.2014 ArticlePubMedPMC
- 13. Bennadi D, Kashinath KR, Bharateesh JV, Kshetrimayum N. Assessing learning preferences of dental students using visual, auditory, reading-writing, and kinesthetic questionnaire. J Indian Assoc Public Health Dent 2015;13:163-168. https://doi.org/10.4103/2319-5932.159055 Article
- 14. AlQahtani N, AlMoammar K, Taher S, AlBarakati S, AlKofide E. Learning preferences among dental students using the VARK questionnaire: a comparison between different academic levels and gender. J Pak Med Assoc 2018;68:59-64. PubMed
- 15. Asiry MA. Learning styles of dental students. Saudi J Dent Res 2016;7:13-17. https://doi.org/10.1016/j.sjdr.2015.02.002 Article
Citations
Citations to this article as recorded by

- Quantitative Evaluation of Dental Students’ Perceptions of the Roleplay-Video Teaching Modality in Clinical Courses of Dentistry: A Pilot Study
Kiran Kumar Ganji, Anil Kumar Nagarajappa, Mohammed G Sghaireen, Kumar Chandan Srivastava, Mohammad Khursheed Alam, Shadi Nashwan, Ahmad Al-Qerem, Yousef Khader
Healthcare.2023; 11(5): 735. CrossRef - Effectiveness of differentiated instruction on learning outcomes and learning satisfaction in the evidence‐based nursing course: Empirical research quantitative
Shwu‐Ru Liou, Ching‐Yu Cheng, Tsui‐Ping Chu, Chia‐Hao Chang, Hsiu‐Chen Liu
Nursing Open.2023; 10(10): 6794. CrossRef - Empowering individual learners: Call for promoting inclusivity among medical students with different learning styles
SaurabhRamBihariLal Shrivastava, Novina Aryanti, Arief Wibawa
Environmental Disease.2023; 8(3): 78. CrossRef - Unveiling the learning style puzzle: Factors that shape how medical students learn
SaurabhRamBihariLal Shrivastava, DhiyaulAthifah M. Jasri
Indian Journal of Health Sciences and Biomedical Research (KLEU).2023; 16(3): 435. CrossRef - Knowledge, attitude and practice of dentists toward providing care to the geriatric patients
Bahareh Tahani, Skekoufeh Sedaghat Manesh
BMC Geriatrics.2021;[Epub] CrossRef - The effect of learning style and general self-efficacy on satisfaction of e-Learning in dental students
Tahereh Baherimoghadam, Shahram Hamedani, Manoosh mehrabi, Navid Naseri, Nooshin Marzban
BMC Medical Education.2021;[Epub] CrossRef - Identification of Preferred Learning Style of Medical and Dental Students Using VARK Questionnaire
Ayesha Fahim, Saba Rehman, Fariha Fayyaz, Mariyah Javed, Muhammad Anwaar Alam, Sadia Rana, Fahim Haider Jafari, Mohammad Khursheed Alam, Mauro Henrique Nogueira Guimarães Abreu
BioMed Research International.2021; 2021: 1. CrossRef - Assessing the Students’ Perception of the Quality of Dental Program offered in Saudi Arabia
Ahmed Al Kuwaiti
The Open Dentistry Journal.2021; 15(1): 650. CrossRef - General Self-Efficacy and Self-Perceived Confidence of Dental Students in Performing Orthodontic Clinical Skills
Shahla Momeni Danaei, Niloofar Azadeh, Dana Jafarpur
Educational Research in Medical Sciences.2018;[Epub] CrossRef - Learning Style and Academic Achievement among Students at Tabriz University of Medical Sciences, Iran
Horyeh Sarbazvatan, Abolghasem Amini, Nayyereh Aminisani, SeyedMorteza Shamshirgaran, Saeideh Ghaffarifar
Research and Development in Medical Education.2018; 7(2): 77. CrossRef

 , Hosein Mirkazemi1

 , Hallym University, Korea
 PubReader
 ePub Link
 Cite
Cite