Exploration of examinees’ traits that affect the score of Korean Medical Licensing Examination
Article information

Abstract
Purpose:
It aims to identify the effect of five variables to score of the Korean Medical Licensing Examinations (KMLE) for three consecutive years from 2011 to 2013.
Methods:
The number of examinees for each examination was 3,364 in 2011 3,177 in 2012, and 3,287 in 2013. Five characteristics of examinees were set as variables: gender, age, graduation status, written test result (pass or fail), and city of medical school. A regression model was established, with the score of a written test as a dependent variable and with examinees’ traits as variables.
Results:
The regression coefficients in all variables, except the city of medical school, were statistically significant. The variable’s effect in three examinations appeared in the following order: result of written test, graduation status, age, gender, and city of medical school.
Conclusion:
written test scores of the KMLE revealed that female students, younger examinees, and first-time examinees had higher performances.
INTRODUCTION
Various factors affect a person’s test results. In evaluating individual achievement, one cannot overlook personal traits and the influence of the groups to which a person belongs. The influence that such factors have on a student’s achievement is a research subject in itself or a variable that needs to be controlled in comparing the performance between groups. Interest in academic achievement can go beyond general results, such as means and deviations, and develop into more specific questions, such as the following: Do male or female students have higher academic performance?; What examinees’ traits are associated with higher test scores? It aims to explore how much influence the variables of individuals or groups such as examinees’ gender, age, graduation status, location of medical school, and test result (pass or fail) have on test score, the relative influence of variables, and the inter-group differences of test score of the Korean Medical Licensing Examination (KMLE) from 2011 to 2013.
METHODS
Subjects and materials
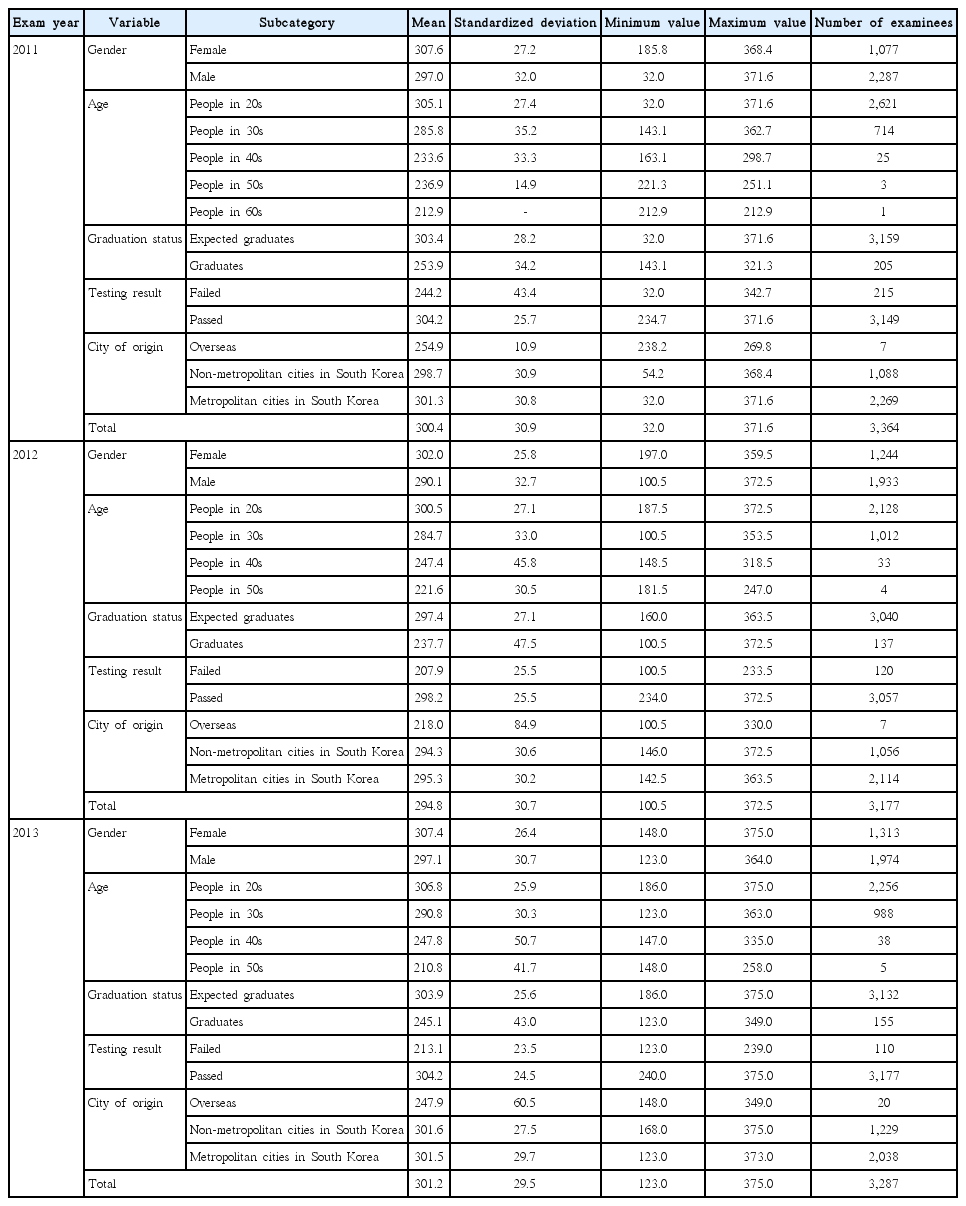
The target of this study was the test results of three consecutive year Korean Medical Licensing Examination from 2011 to 2013. The number of examinees for each examination was 3,364 in 2011, 3,177 in 2012, and 3,287 in 2013. KMLE is taken by expected medical school graduates, medical school graduates who failed previous examinations, and those who graduated from overseas institutions. Therefore, the data used in this study are not the findings from several medical schools or estimated data based on sampling but whole data for three consecutive years.
Five characteristics of examinees were set as variables: gender, age, graduation status, written test result (pass or fail), and city of medical school. The gender was divided into male and female; the age was divided into 5 age groups (people in their 20s, 30s, 40s, 50s, and 60s); graduation status was divided into expected graduates and graduates; written test result was divided into a group who passed and a group who failed. With regard to the city of origin, medical schools were divided by location: in South Korea or in other countries. The medical schools in South Korea were divided into two groups: schools in metropolitan cities (including Seoul) and schools in non-metropolitan cities.
Analysis method
A regression model was established, with the score of a written test as a dependent variable and with examinees’ traits as variables. The total score of all variables was analyzed with regression analysis to determine how the variables affected the written test scores in KMLE. For the analysis, IBM SPSS ver. 20.0 (IBM Co., Armonk, NY, USA) was used. The following is the regression model with the total score as a dependent variable and five factors as independent variables.
Y=B1X1+B2X2+B3X3+B4X4+B5X5+e
Y: Total score
X1: Gender, 0=female 1=male
X2: Age, 0~4=20’s~60’s
X3: Graduation Status, 0=expected graduates 1=graduates
X4: Testing Result, 0=failed 1=passed
X5: City of Origin, 0~2=overseas~metropolitan cities in South Korea
e: Residual
The total score from the 2011 KMLE was 450 points whereas the total scores from the 2012, 2013 examinations were 400 points each. Therefore, the score from the 2011 examination in the descriptive statistics was converted to 400 points. Because the score conversion does not affect the regression analysis, the explanatory power of the regression model or the significance test result is the same as that of the unconverted score. Converted score of the 2011 examination regression co-efficient can be compared with the results of the 2012 and the 2013 examinations.
RESULTS
The present study established a regression model with examinees’ variables and examined the size of the effect and the direction of each individual variable on written test scores. Its original interest was to observe the effect size, based on each variable, but the established model can predict test results. Table 1 showed the descriptive statistics of the total scores of each group, based on the year of KMLE. The explanatory power of the regression model of each year was shown in Table 2. The significance level in the established regression model was 0.05, as shown in Table 3. The explanatory power of each examination was 32% for the 2011 examination, 39% for the 2012, and 38% for the 2013; corresponding variables account for the total score range (range, 32% to 38%). In terms of individual variables, Table 4 showed standardized regression coefficient and non-standardized regression coefficient for each examination number, as well as the significance probability. In all three examinations, the order of significant variables and the effect size of each variable were the same. The regression coefficients in all variables, except the city of medical school, were statistically significant. The variable’s effect in three examinations appeared in the following order: result of written test, graduation status, age, gender, and city of medical school. This means that the scores in controlled conditions differed significantly by gender, age, graduation status, and written test results. However, the score based on city of medical school did not show a significant difference (P > 0.05).
Descriptive statistics of the total scores of each classified group of test takers of Korean Medical Licensing Examination from 2011 to 2013

Explanatory power of the regression model of each year for Korean Medical Licensing Examination from 2011 to 2013
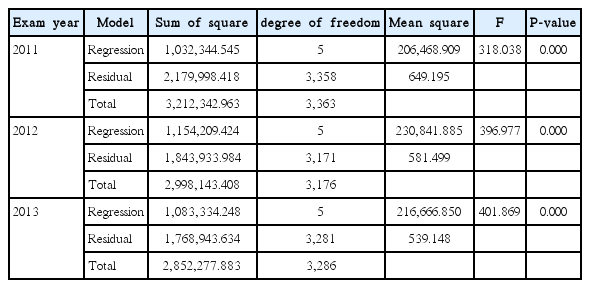
Significance probability in the established regression model by analysis of variance
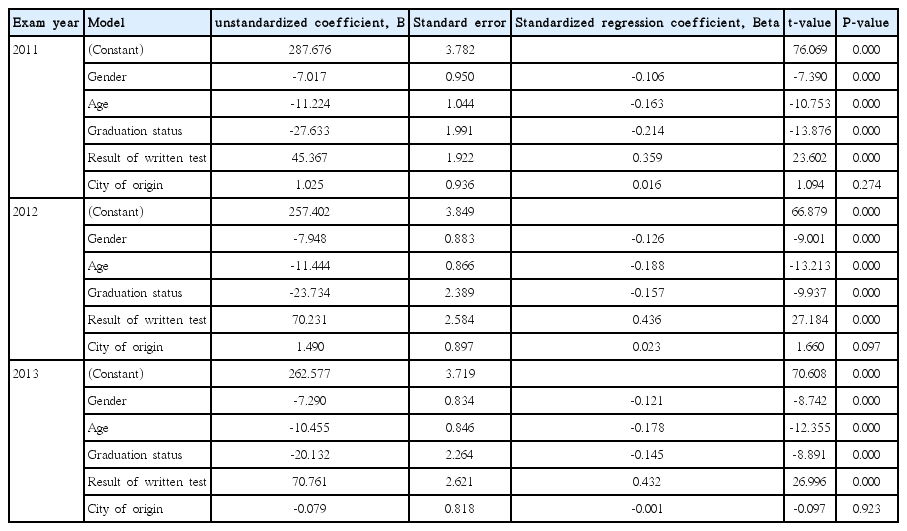
Standardized regression coefficient and unstandardized regression coefficient for each examination year, as well as the significance probability for Korean Medical Licensing Examination from 2011 to 2013
Table 5 compares the regression coefficient of each examination and shows the average difference among the groups. Overall, when other conditions were the same, female students scored 7 points higher than did male students. The younger the examinees were, the higher they scored: people in their 20s scored higher than did people in their 30s; people in their 30s scored 11 points higher than did people in their 40s. On written tests, expected graduates scored 24 points higher than did graduates. With all other conditions the same, examinees who passed the written test are expected to score 62 points higher than those who failed it. The score, based on city of origin, differed in each examination, which implies the effect of examinees who graduated overseas in a particular year. Table 1 showed the number of examinees from overseas: the number is small and the number varies each year; their origins are not equally distributed [1]. In one year, the majority may have come from developed countries; while in another year, all of the overseas examinees may have come from South America or Eastern Europe. Because of differences in groups, the scores were not consistent and cannot be interpreted as a representing a group. The score of overseas examinees had a great effect because there was a very small difference between the examinees from metropolitan cities and those from non-metropolitan cities in South Korea. Therefore, with regard to the scores based on the city of medical school in 2011 and 2012 examinations, domestic examinees scored higher than did overseas examinees; Those from metropolitan cities scored one or two points higher than did those from non-metropolitan cities in South Korea. However, in the 2013 examinations, the overseas examinees scored slightly higher than did the domestic examinees. In this analysis, North Korean defectors were placed in the category of overseas examinees. With regard these examinees, the passing rates varies every year: one person passed the examinations in 2005, one in 2006, one of four in 2007, seven of eight in 2008, three of eight in 2010, and three of seven in 2012 [2].
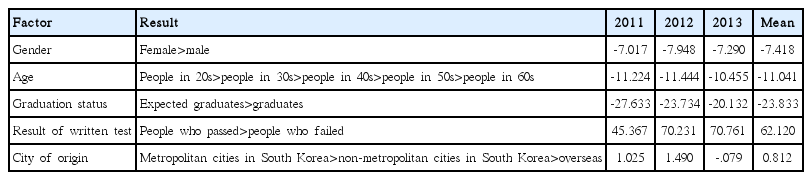
Difference of regression coefficient of each examination by group and the mean difference among the groups for Korean Medical Licensing Examination from 2011 to 2013
DISCUSSION
This study analyzed the test scores of three consecutive year KMLEs from 2011 to 2013 and verified the effect of individual variables on test scores. Based on these findings, it is possible to infer with group is most likely to score the highest or the lowest on the written test of the KMLE. One can predict that female medical students in their 20s from metropolitan cities in South Korea are likely to pass the KMLE with a score 63 points higher on average than men in their 50s or over who have graduated. The analysis of the written test scores of the KMLE revealed that female students, younger examinees, and first-time examinees had higher performances. This tendency and the score differences were not limited to one examination, but verified for several recent years. It does not simply suggest that female students will score higher; rather, given the same circumstances, female students are expected to score 7 points higher than male students do. Even in the same gender group, the score can differ by 11 points, based on age. Furthermore, in the same gender and age group, the score can differ by 24 points, based on graduation status. The present study verified that the score difference by a examinees’ city of medical school changes according to the examinees of the year and does not have a general orientation. The location of the domestic medical school also did not affect the performance of the written test, which indicates the standardization of medical school performance in written tests. It focuses on the location of medical schools, such as those in metropolitan versus non-metropolitan cities or domestic schools versus foreign schools, rather than on the differences between individual schools.
It is hard to find the any effects of variables used in this study on nation-based high stakes examination. In one university, it was found that female students have higher academic performances than male students and female students got higher score in KMLE than male [3]. The ratio of female medical students is gradually increasing, and female students are scoring high, even in high-stakes testing [1].Although the data in this study are large-scale data, the data have limitations in that they only show test scores and do not link academic performance before and after the examinations. Furthermore, because of the minimized data collection of examinees’ personal information, the variables that could be used were limited. For follow-up studies, future researchers can analyze whether students display similar academic performance during the school year or analyze test scores based on diverse factors that relate to the cognitive and psychological characteristics of a student, such as specific personal traits, academic performance, or academic motivation.
This study is significant in that the performance differences among examinees on a national level testing could be identified with objective data. When other conditions were controlled, the orientation of the difference and the size of the difference, based on gender or age, were identified. These findings can be used as an index of examinees’ performance levels in KMLE, a foundation for future research on high-performing or low-performing groups, and an aid in the development of teaching methods to improve academic performance.
Notes
No potential conflict of interest relevant to this article was reported.
SUPPLEMENTARY MATERIAL
Audio recording of the abstract.